 eAtlas Data Catalogue
Australian Institute of Marine Science (AIMS)
Type of resources
Topics
Keywords
Contact for the resource
Provided by
Years
Formats
Representation types
Update frequencies
status
Scale
-
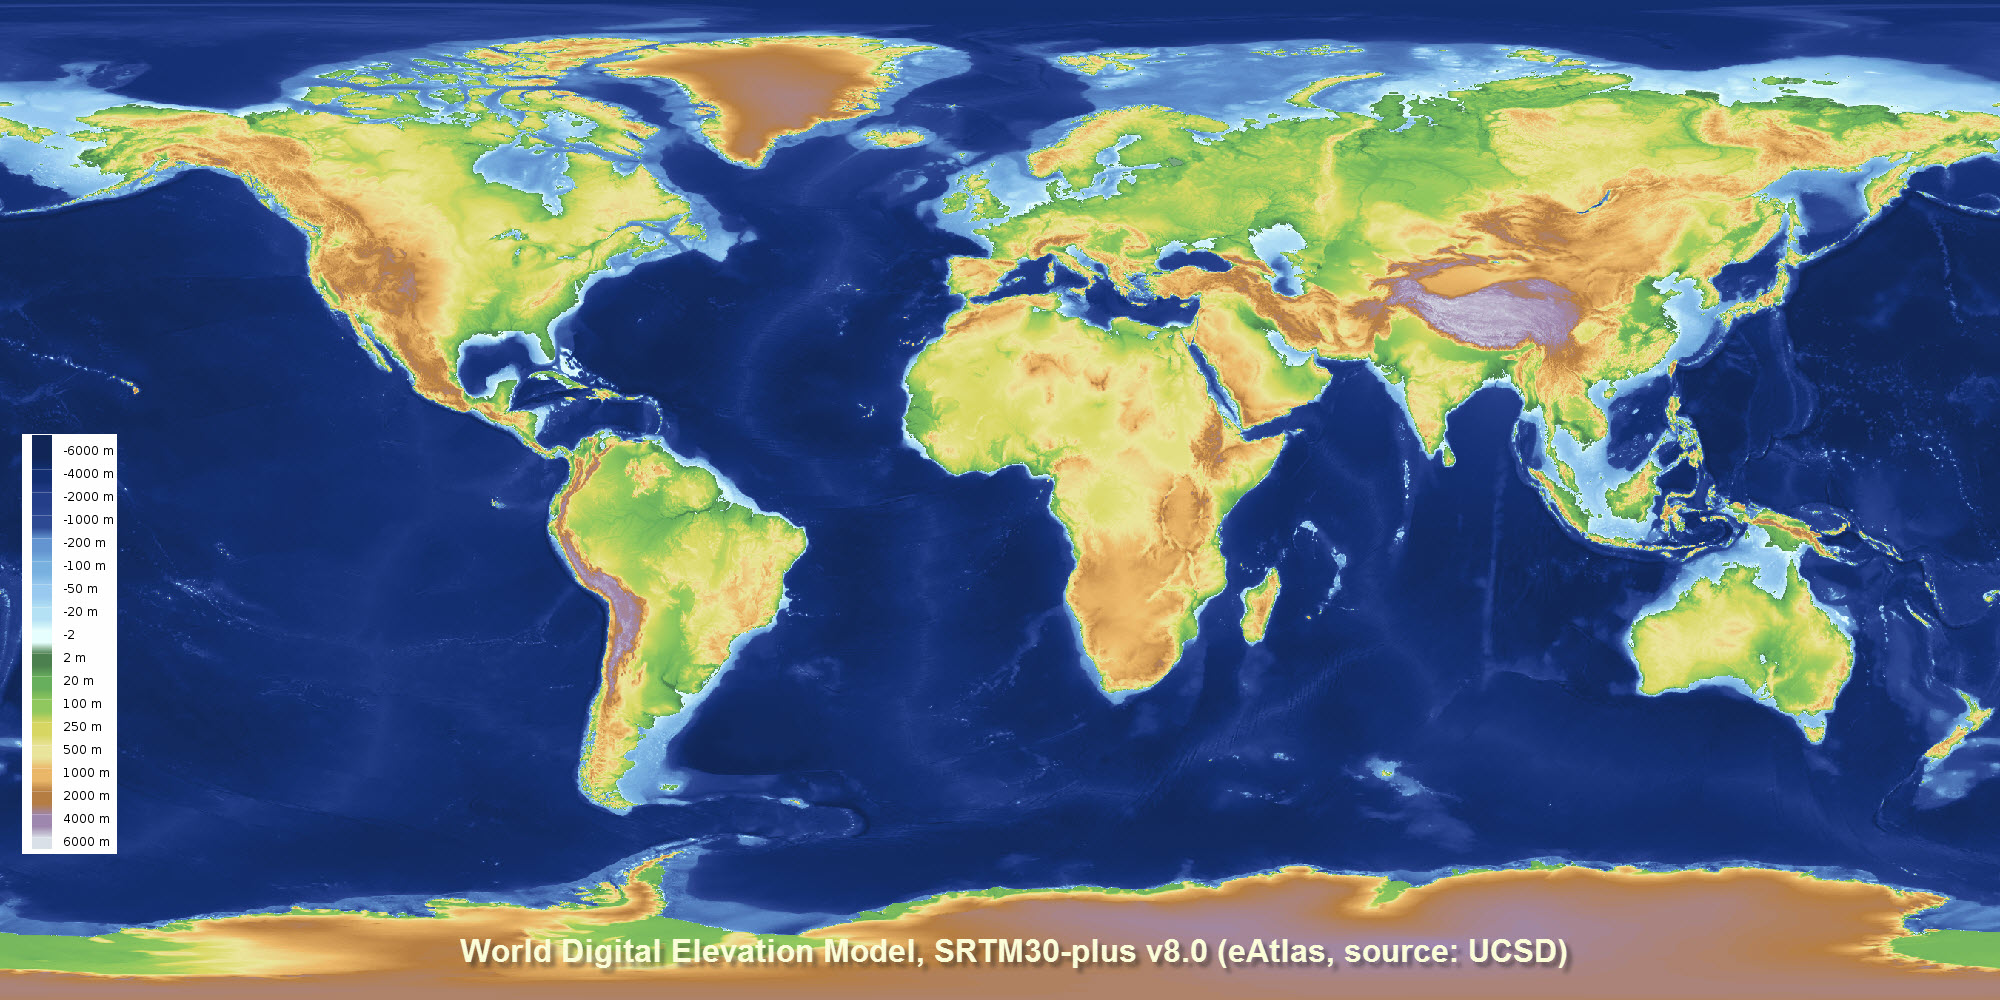
This dataset corresponds to a reformatting of the SRTM30_PLUS digital elevation dataset from 33 NetCDF files into a single GeoTiff for use in GIS applications. No other modifications to the data were done. The rest of this metadata describes the original SRTM30_PLUS dataset itself. Note: The SRTM15_plus dataset is a similar more recent, higher resolution bathymetry dataset https://topex.ucsd.edu/WWW_html/srtm15_plus.html. This dataset is a 30-arc second resolution global topography/bathymetry grid (SRTM30_PLUS) developed from a wide variety of data sources. Land and ice topography comes from the SRTM30 and ICESat topography, respectively. Ocean bathymetry is based on a new satellite-gravity model where the gravity-to-topography ratio is calibrated using 298 million edited soundings. The main contribution of this dataset is the compilation and editing of the raw soundings, which come from NOAA, individual scientists, SIO, NGA, JAMSTEC, IFREMER, GEBCO, and NAVOCEANO. The SRTM30_PLUS dataset developed by Scripps Institute Of Oceanography, University of California San Diego (UCSD). Land data are based on the 1-km averages of topography derived from the USGS SRTM30 grided DEM data product created with data from the NASA Shuttle Radar Topography Mission. GTOPO30 data are used for high latitudes where SRTM data are not available. Ocean data are based on the Smith and Sandwell global 1-minute grid between latitudes +/- 81 degrees. Higher resolution grids have been added from the LDEO Ridge Multibeam Synthesis Project, the JAMSTEC Data Site for Research Cruises, and the NGDC Coastal Relief Model. Arctic bathymetry is from the International Bathymetric Chart of the Oceans (IBCAO) [Jakobsson et al., 2003]. This data consists of 33 files of global topography in the same format as the SRTM30 products distributed by the USGS EROS data center. The grid resolution is 30 second which is roughly one kilometer. In addition the global data are also available in a single large file ready for GMT and as 33 NetCDF files. The eAtlas has also merged and formatted the data as a single GeoTiff file with overviews (1.6 GB). The pixel-registered data are stored in 33 files with names corresponding to the upper left corner of the array shown below. The data are also merged into a single large (1.9 Gbyte, 2-byte integer) file as well as smaller 1-minute and 2-minute netcdf versions. Matching files of source identification number are available for determining the data source for every pixel. This new version (v8.0) includes all of the multibeam bathymetry data collected by U.S. research vessels over the past three decades including 287 Scripps expeditions from research vessels Washington, Melville and Revelle. UCSD undergraduate student Alexis Shakas processed all the U.S. multibeam data and then worked with Google researchers on the global integration. The data is available from UCSD FTP server as 33 NetCDF files and from the eAtlas as a merged GeoTiff. If you are after high resolution bathymetry/elevation data for regional areas please check the related links. Reference, sounding data: Becker, J. J., D. T. Sandwell, W. H. F. Smith, J. Braud, B. Binder, J. Depner, D. Fabre, J. Factor, S. Ingalls, S-H. Kim, R. Ladner, K. Marks, S. Nelson, A. Pharaoh, R. Trimmer, J. Von Rosenberg, G. Wallace, P. Weatherall., Global Bathymetry and Elevation Data at 30 Arc Seconds Resolution: SRTM30_PLUS, Marine Geodesy, 32:4, 355-371, 2009. http://topex.ucsd.edu/sandwell/publications/124_MG_Becker.pdf Reference, gravity data: Sandwell, D. T., and W. H. F. Smith, Global marine gravity from retracked Geosat and ERS-1 altimetry: Ridge Segmentation versus spreading rate, J. Geophys. Res., 114, B01411, doi:10.1029/2008JB006008, 2009. http://dx.doi.org/10.1029/2008JB006008 eAtlas Processing: A set of Batch scripts were developed to perform the conversion of the data from NetCDF to GeoTiff and the generation of the hillshading. This processing was based on the GDAL command line tools. Full details of the processing can be found in the downloadable Scripts associated with this dataset. Data Location: This dataset is filed in the eAtlas enduring data repository at: data\NERP-TE\13.1_eAtlas\World_UCSD_SRTM30-plus
-
The eAtlas baselayer is a collection of datasets from third parties styled and combined together to produce a world wide map layer with reasonable detail across the Great Barrier Reef suitable as a baselayer in web mapping applications. The primary basis for this baselayer is the Natural Earth 2 public domain raster map of the world. Overlaid on this is country outlines, cities and Great Barrier Reefs. It has a focus on Australia and the Great Barrier Reef and includes a high resolution coast for Australia (100k) and an even high resolution coast for Queensland (50k). The baselayer has three levels of nested detail. It starts with the world view datasets (Natural Earth 2 & 10m countries) combined with a high resolution Australian coastline (Coast 100k) combined with a still higher resolution Queensland coastline (GBR features). In addition to this the GBR features combined with the GBR dry reefs provides detailed outlines for reefs within the Great Barrier Reef Marine Park. This nesting is achieved by using a layer group in GeoServer to sandwich all 6 layers together into one map. The styling of the 10m countries layer is done so that all countries except Australia are rendered, leaving a hole for the high resolution Australian coastline. The Coast100k it is styled so that all states are shown except Queensland; again to leave a hole for a higher resolution Queensland coastline. To get the Queensland coastline the GBR features mainland is used. Format: This dataset collection is organised as files in a structure the same as the configuration of GeoServer version 2.1 - 2.3. This allows it to be easily deployed as a web map service. The files can simply be pasted into the GeoServer directory. The data, along with the configuration and styling will be installed. This quick install procedure has been tested on version 2.1.0, 2.2.4 and 2.3 of GeoServer. More recent version may require manual editing deploy the data. The size of this dataset is 260 MB. Note: This dataset has been superseded by the higher resolution Bright Earth eAtlas Basemap (NERP TE 13.1 eAtlas, AIMS) dataset. Data Location: This dataset is filed in the eAtlas enduring data repository at: data\NERP-TE\13.1_eAtlas\World_NERP-13-1_eAtlas_Basemap_v1-2013
-
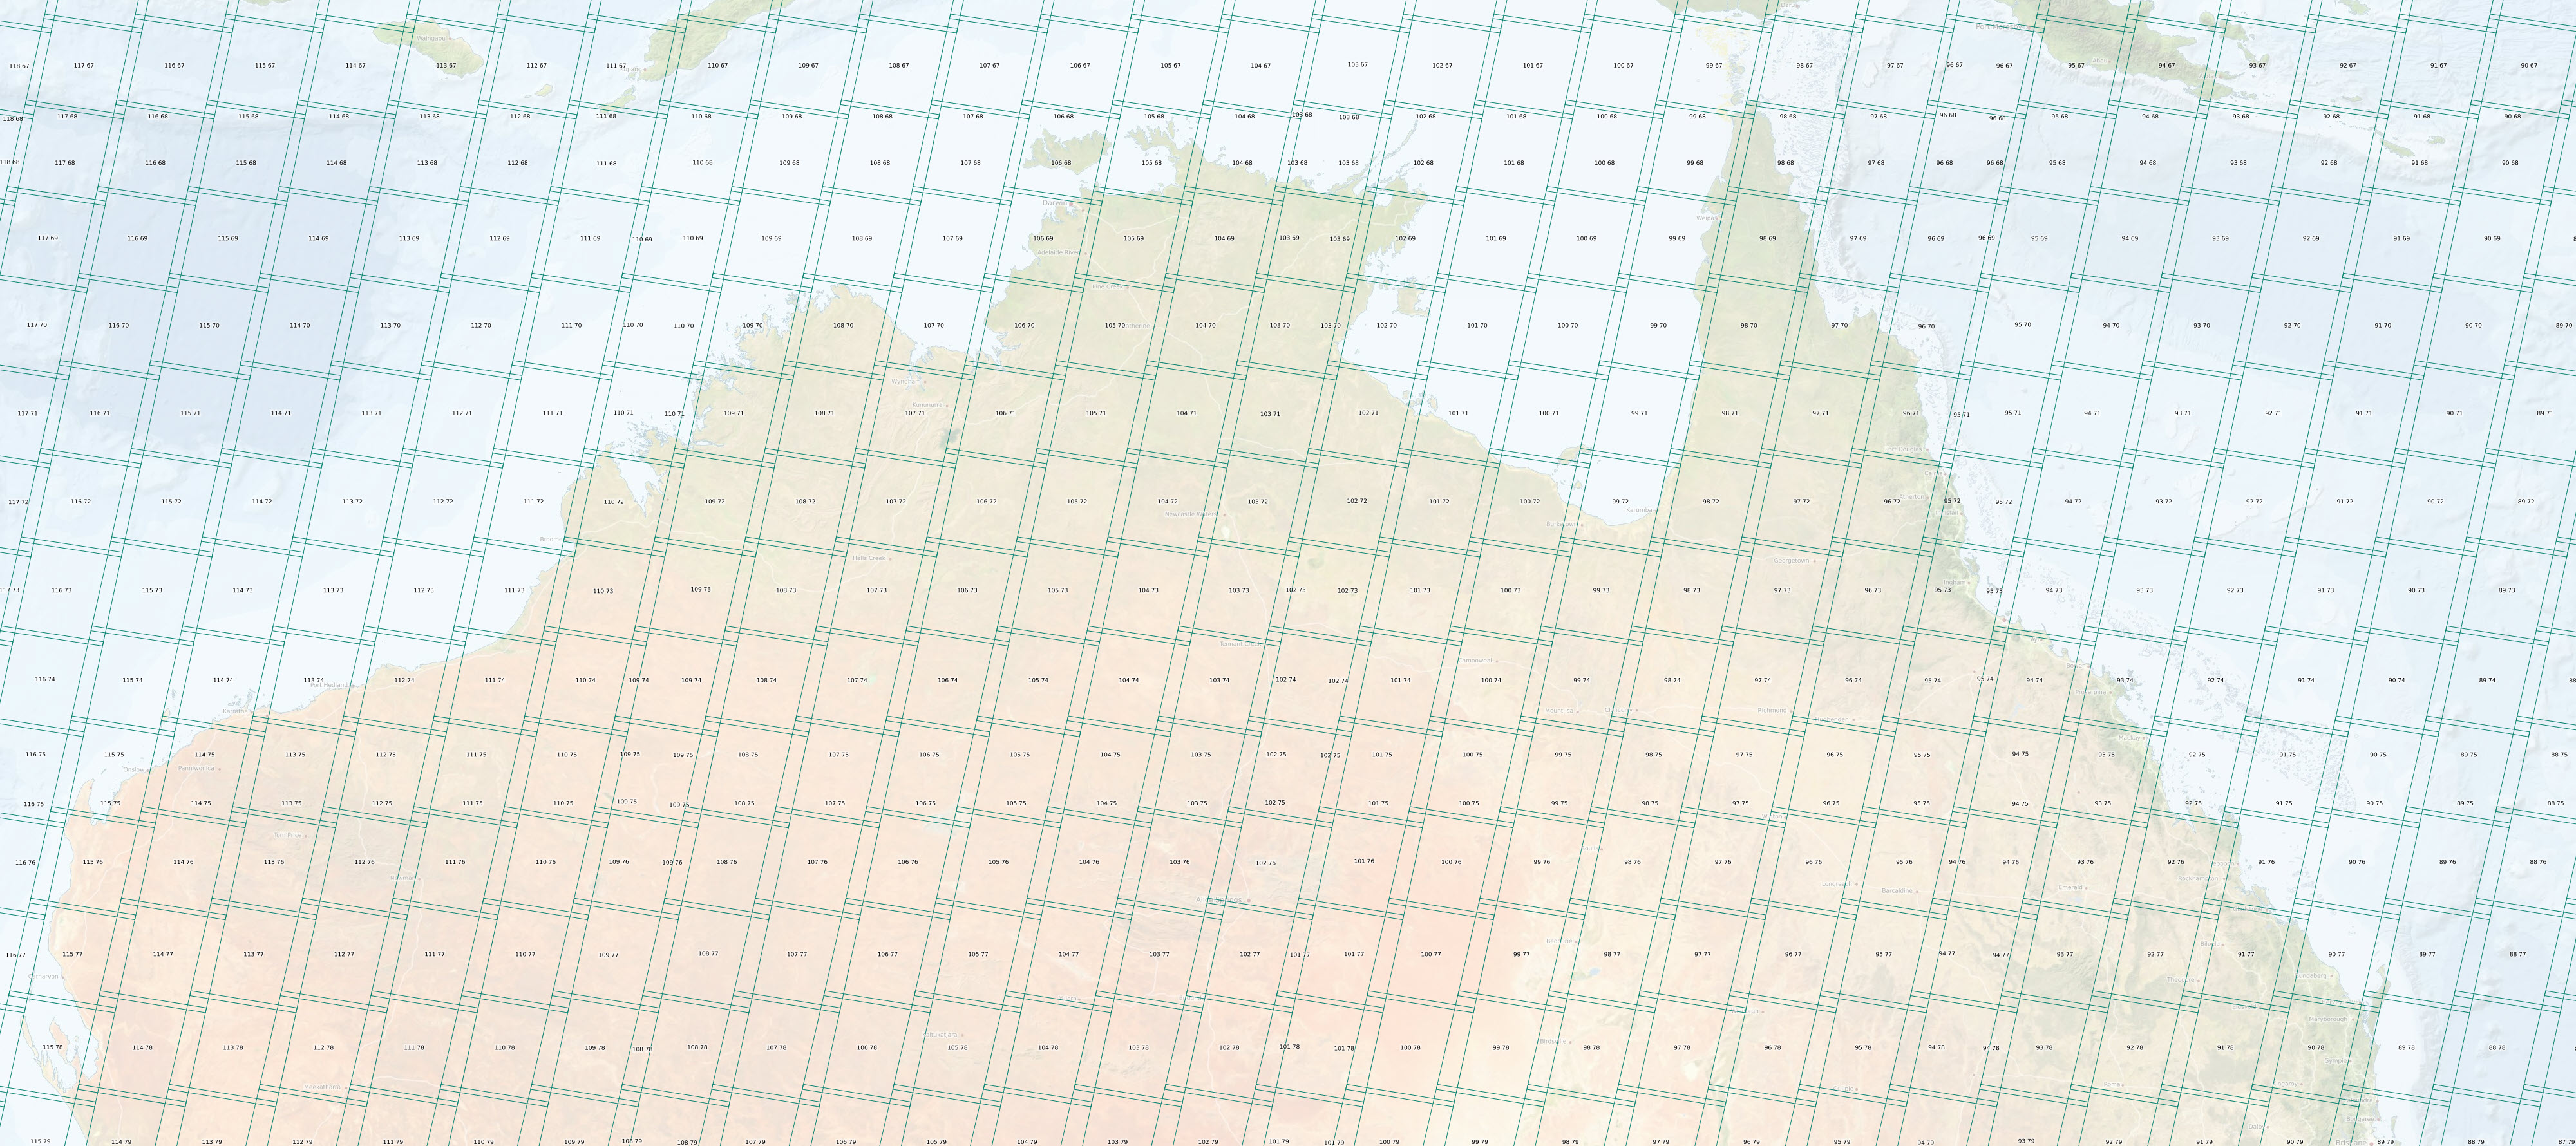
This dataset shows the tiling grid and their Row and Path IDs for Landsat 4 - 9 satellite imagery. The IDs are useful for selecting imagery of an area of interest. Landsat 4 - 9 are a series of Earth observation satellites, part of the US Landsat program aimed at monitoring Earth's land surfaces since 1982. The Worldwide Reference System (WRS) is a global notation system used for cataloging and indexing Landsat imagery. It employs a grid-based system consisting of path and row numbers, where the path indicates the longitude and the row indicates the latitude, allowing users to easily locate and identify specific scenes covering a particular area on Earth. Landsat satellites 4,5,7, 8, and 9 follow WRS-2 which this dataset describes. This dataset corresponds to the descending Path Row identifiers as these correspond to day time scenes. eAtlas Notes: It should be noted that the extent boundaries of the scene polygons in this dataset are only indicative of the imagery extent. For Landsat 5 images the individual images move around by about 10 km and the shape of the Landsat 8 and 9 images do not match the shape of the WRS-2 polygons. The angle of the top and bottom edges are at a different angle to the imagery, where the imagery is more square in shape. The left and right edges of the polygons are also smaller than the imagery. As a result of this, this dataset is probably not suitable as a clipping mask for the imagery for these satellites. This dataset is suitable for determining the approximate extent of the imagery and the associated Row and Path IDs for a given scene. Why is this dataset in the eAtlas?: Landsat imagery is very useful for the studying and mapping of reef systems. Selecting imagery for study often requires knowing the Path and Row numbers for the area of interest. This dataset is intended as a reference layer. This metadata is included to link to from the associated mapping layer. The eAtlas is not the custodian of this dataset and copies of the data should be obtained from the original sources. The eAtlas does however keep a cached version of the dataset from the time this dataset was setup to make available should the original dataset no longer become available. eAtlas Processing: The original data was sourced from USGS (See links). No modifications to the underlying data were performed. Location of the data: This dataset is filed in the eAtlas enduring data repository at: data\\non-custodian\2020-2024\World_USGS_Landsat-WRS-2
-
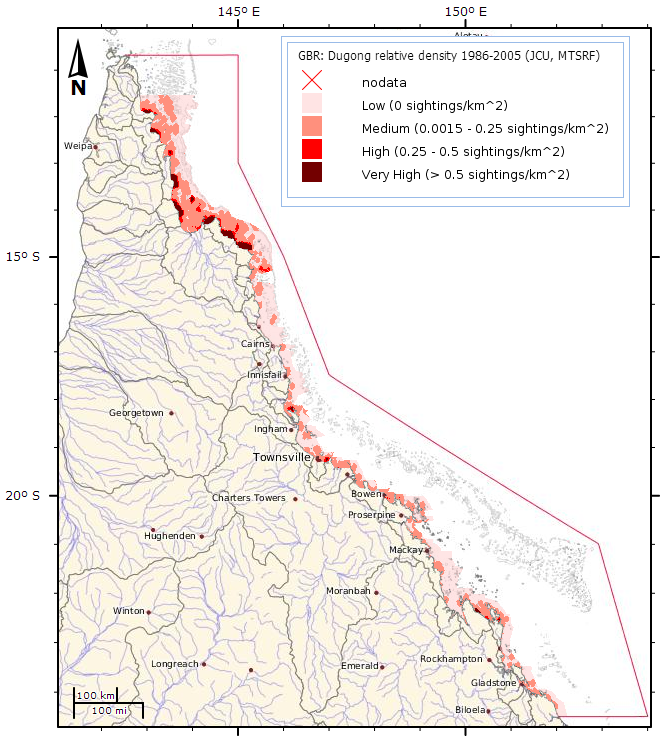
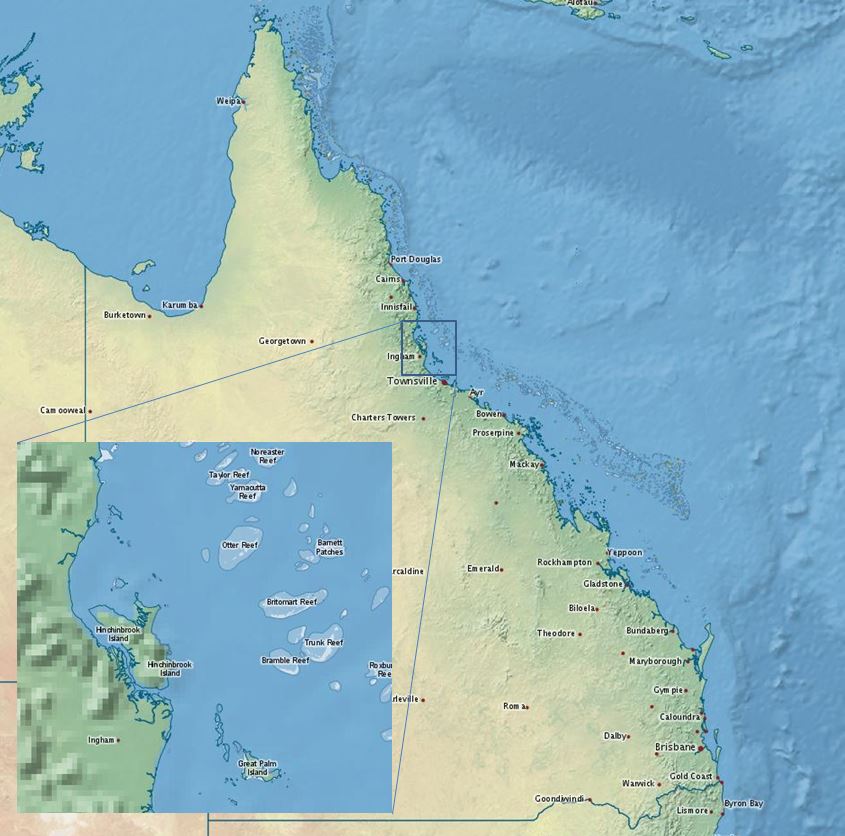
This dataset shows a spatial model of the distribution and relative density of dugongs (Dugong dugong) in the Torres Strait region based on an aggregate of 19 years (1986, 1987, 1992, 1994, 1999, and 2005) of systematic aerial surveys. For more information on the methods used in the creation of this dataset see Grech. A., and Marsh. H. (2007) - Prioritising areas for dugong conservation in a marine protected area using a spatially explicit population model, Applied GIS, 3(2), 1-14. All surveys were conducted in late spring or early summer when weather and sea states provide optimum survey conditions. This data presents the results of a model of dugong distribution and abundance, based on data collected from dugong aerial surveys, in conjunction with geostatistical techniques including universal kriging (Grech and Marsh 2007). After completing the model, frequency analyses were conducted to categorise relative dugong density and distribution to identify areas of low, medium or high conservation value. The modelled abundance and distribution show the relative density of dugongs (areas where there are more or less dugongs) and NOT the absolute dugong density as corrections for perception bias (animals that are available to, but missed by, observers) and availability bias (animals that are unavailable to observers because of water turbidity) can only be applied at the spatial scale of entire surveys (thousands of square kilometres), making them inappropriate for the spatial scale for this dataset. Nonetheless, the relative densities among regions should be approximately comparable (H. Marsh, personal communication). This dataset is being updated as part of Project 1.2 of the National Environmental Research Program. This dataset is an estimate of relative dugong density (number / km^2) and the conservation value with a 3-point rating (high, medium, low). Note: More recent surveys were completed under the NERP program.
-
Benthic organisms were surveyed annually on fixed sites in one habitat on each of 47 selected core survey reefs from 1993 to 2005 in 6 regions throughout the Great Barrier Reef (GBR). Surveys were undertaken at 3 sites per reef, with 5x50m transects surveyed per site. \n \nIn 2004 a new zoning plan was implemented in the Great Barrier reef Marine Park and in 2006 the pattern of surveys was changed. The original set of reefs (47) are surveyed in odd years (e.g. 2007) and a different set (56 reefs) are surveyed in even years. The new set consists of paired reefs (one no-take, and one open to fishing) surveyed to assess the effects of rezoning. The paired reefs are near Cairns and Innisfail, Townsville, Mackay, the Swain Reefs and the Capricorn-Brunker group. \n \nFrom 1993 to 2006 video transects were recorded and sub-sampled at 200 points per sample. The program was modified in 2007 to allow collection of data from single frames shot at 1m intervals along each transect using a digital still camera. \n \nBenthic groups recorded are: Abiotic; Hard coral; Soft coral; Coralline algae; Macro algae; Turf algae; Sponge; Other; Indeterminate.\n To annually monitor the cover of benthic organisms, reef fish abundance and crown-of-thorns starfish populations on various reefs of the Great Barrier Reef. \n \nThe program has been designed to track changes in reef communities over time across sub-regions of the GBR.\n Parameters: Percentage cover of different substrate types and benthic organisms (particularly corals), identified to benthic group or lifeform level. Data on reef fish abundance and diversity are collected at the same sites and times.\n
-
During the central and eastern Torres Strait survey in November 2006, tissue samples of 10 individuals of the sponge Coscinoderma matthewsi were collected from 5 island groups: Ugar (Stephen Island) and Erub (Darnley Island) in eastern Torres Strait; and the Masig group (Kodall Island and Keats Island), Poruma (Coconut Island) and Warraber (Sue Island) in central Torres Strait. These island groups are on average, 66 km apart. All sponge samples were placed in separate cryo-tubes and preserved in liquid nitrogen until they could be stored at -80°C. Approximately 2 g of tissue from each sample was homogenised in liquid nitrogen and 750 µl of lysis buffer [100 mM Tris pH 9, 100 mM EDTA, 1% SDS, 100 mM NaCl, 0.5 mg/ml Proteinase K], and subsequently incubated at 65°C for 1 hour with gentle agitation. KoAc was added to a final concentration of 1 M, followed by incubation on ice for 30 minutes. The samples were centrifuged at 8000 rpm for 15 minutes, and the supernatant was reserved for DNA precipitation with isopropanol using the standard protocol.A fragment of nuclear DNA containing part of the 28S rRNA gene was amplified for all individuals using RD3A (5'-GACCCGTCTTGAAACACGA) and RD5B2 (5'- ACACACTCCTTAGCGGA) primers. Recombinant Pfu Polymerase (Fermentas) was used for the PCR. A total of 50 µl of reaction mixture was prepared for each sample according to the protocol. PCR was performed under the following conditions: initial denaturation at 95°C for 3 minutes; 35 cycles of 95°C for 30 seconds, 50°C for 20 seconds, 72°C for 1 minute; a final extension step of 72°C for 10 minutes. Products were purified with QIAquick (Qiagen) columns according to protocol. Sequencing was performed at Macrogen Inc. with a 3730xl DNA analyser using both forward and reverse primers.For microbial analysis, a DNA fingerprinting technique (denaturing gradient gel electropohoresis - DGGE) was used to determine the stability of bacterial associations within Coscinoderma matthewsi across wide spatial scales.Four replicate sponges were analysed from Keats Island and Kodall Island and three replicate sponges were analysed from Erub, Ugar, Poruma and Warraber. DNA was extracted from individual sponges by homogenising approx 1g of tissue from each individual in 0.5 ml of grinding buffer (2 ml 1 M Tris, 4 ml 0.5M EDTA, 2 ml 10% SDS, 400 µl 5 M NaCl and 11.6 ml distilled water). Tubes were immersed in liquid nitrogen and ground with plastic pestles. Samples were incubated at 65ºC for 60 min prior to addition of 187 µl 5 M potassium acetate. Samples were incubated on ice for 30 min and centrifuged at 8000 x g for 15 min. The supernatants were transferred to fresh tubes and DNA was precipitated with 0.8 vol of isopropanol.The 16S rDNA from each sample was amplified by PCR with universal bacterial primers 1055f: 5'-ATG GCT GTC GTC AGC T-3' and 1406r: 5'-ACG GGC GGT GTG TAC-3'. The reverse primer was modified to incorporate a 40 bp GC clamp. Primers 1055f and 1406r match over 56,000 and 62,800 sequences respectively in the Ribosomal Database Project. Products from triplicate PCR reactions were combined and 15 µl applied to duplicate 40% wt/vol polacrylamide (37:5:1) gels containing a 50-70% denaturing gradient of formamide and urea. Gels were electrophoresed at 60ºC for 17 h in 1 x TAE buffer at 50V using the Ingeny D-Code system. Gels were stained with 1 x Sybr Gold for 30 min, visualised under UV illumination and photographed.\n This project was undertaken to determine connections between sponge populations in central and eastern Torres Strait and to assess whether there would be any risks associated with translocation of sponges across large areas. Risks investigated were the possibility of transfers between genetically distinct populations, which would result in a decrease in the genetic diversity of wild populations or the potential to introduce new sponge-associated microbe types into a region.\n
-
64 'key' reefs in 11 sectors of the Great Barrier Reef (Cape Grenville, Princess Charlotte Bay, Cooktown/Lizard Island, Cairns, Innisfail, Townsville, Cape Upstart, Whitsunday, Pompey Complex, Swain and Capricorn Bunker) are annually surveyed for crown-of-thorns starfish using the manta tow technique. An additional 117 reefs from the sectors (excluding the Whitsunday, Swain and Capricorn-Bunker sectors) are scheduled for survey every third year ('cycle' reefs). The cycle manta tow reefs take second priority if surveys are unable to be completed because of bad weather and limited ship time. \n \n Results of manta tow surveys around the perimeter of reefs assessing populations of Crown-of-Thorns Starfish (COTS), Acanthaster cf. solaris. Historical data are held from a number of projects - P. Moran's post-doctoral work, CCEP scheme, COTSAC, COTSREC, LTMP. All data are stored in the Oracle database table RM_MANTA, and data from all but the first listed program are generally consistent and systematic. In the latest and ongoing program - the Long Term Monitoring Program (LTMP) - about 50 reefs throughout the Great Barrier Reef and NW Australia have been sampled. \n \n Observations started in January 1982 and are ongoing. \n \n For each two-minute manta tow the variables recorded are: Number and size of COTS; Percentage cover of live coral, dead coral, and soft coral; Visibility; Any other observations of note. \n \n The ambient variables recorded include, information about the survey (reef name, time, date, data collectors), and the weather conditions:(Wind strength; Cloud cover; Sea state; and Tide). \n \n Information is also recorded about the reef environment of each survey (e.g. reef slope, substratum at reef base) and its benthic community (dominant benthic group, dominant hard coral, and dominant coral life form).\n To assess populations of Crown-of-Thorns Starfish (COTS), Acanthaster cf. solaris, on reefs.\n Coral Reef - Feeding Scar, Crown of Thorns Starfish - Diameter, Crown of Thorns Starfish - Outbreak Status, Percentage Cover, Count - Individuals, Turbidity \n \n Number and size of COTS. Size is recorded as follows: J = less than or equal to 5cm, early juvenile, <1 yr; A = 6-15cm Juvenile, 1-2 yrs; B = 15-25cm Sub-Adult, 2-3 yrs; C = >25cm Adult, >3 yrs). If no COTS are seen, then the column is left blank. When several size categories are seen, the category with the most numerous counts is recorded, and a note is made of the other size categories in the 'other' column. \n Percentage cover of live coral, dead coral, and soft coral. Categories are: 0 = 0%, 1- = 1-5%, 1+ = 5-10%, 2 = 10-30%, 3 = 30-50%, 4 = 50-75%, 5 = 75-100%. \n Presence of COTS feeding scars: absent (A: 0), present (P: 1-10) or common (C >10). \n \n The ambient variables recorded include, information about the survey (reef name, time, date, data collectors), and the weather conditions: \n Wind strength categories: 1 = 0-5 knots; 2 = 6-10 knots; 3 = 11-15 knots; 4 = 16-20 knots; 5 = 21-25 knots \n Cloud cover unit of measure is the okta. One okta = one eigth of the sky. \n Sea State. A modified Beaufort scale describes sea state: Calm = Mirror-like to small ripples; Slight = Small waves, some whitecaps; Moderate = Moderate waves, many whitecaps; Rough = Large waves 2-3 m, whitecaps everywhere, some spray \n Tide is recorded as low (1.5 hrs either side of Low water), high (1.5 hrs either side of High water), falling (between High and Low water) or rising (between Low and High water), determined from a Tide Table. \n \n Data have been used for the e-Atlas: \n http://e-atlas.org.au/content/large-scale-manta-tow-surveys-densities-crown-thorns-starfish-and-benthic-cover-aims-ltmp\n
-
Size frequency surveys of the sponges Coscinoderma matthewsi, Hyrtios erecta and Ianthella basta (yellow color morph) were conducted at Masig Island, central Torres Strait, in March 2007. At each of eight sites, separated by at least 200 m, three randomly positioned 30 x 1 m transects were surveyed, with each transect separated by at least 20 m. All transects were located on sloping reef at between 10 and 12 m depth.The greatest dimension of each sponge was measured for Coscinoderma matthewsi and Ianthella basta, and used as an approximation of overall sponge size. Due to the branching morphology of Hyrtios erecta, the length of each individual branch was included to give an overall measurement. Sponges were also assigned a competition class based on the percentage of their perimeter in contact or within 1 cm of surrounding or encroaching organisms.Three tissue samples, each 1-2 cm³ were collected from 20 different individuals of each species from a single site to examine the influence of sponge size on bioactivity. Prior to sampling, sponges were also measured for size, photographed and assigned a competition class. The sponges sampled encompassed the full size range of each respective species, except for very small sponges, which did have sufficient tissue to obtain three independent tissue samples. Sponges displaying signs of disease were not sampled. Samples were frozen at -20°C within one hour of collection and kept frozen until freeze dried.Freeze-dried sponge tissue samples were weighed and extracted 3 times with methanol (MeOH). Crude extracts were made up into a 100 mg/ml concentration in MeOH based on individual extract weights. 100 µl of each sample was then aliquoted to microtitre plates and dried down, yielding 10 mg of dry extract per sample for bioactivity screening.The production of bioactive metabolites and overall bioactivity of sponges was examined using the sulforhodamine B (SRB) assay. Crude extracts were re-suspended in dimethyl sulfoxide (DMSO) and added to 96 well plates containing 100 µl of pre-incubated cell suspension. Several concentrations were tested for each species, with the concentration showing the greatest fine-scale variation in toxicity between individual samples selected for the analyses: 100 µg/ml for Coscinoderma matthewsi; 0.1875 µg/ml for Hyrtios erecta; and 100 µg/ml for Ianthella basta. One replicate plate was made for each sample plate and for each concentration, with appropriate controls. After 48 hours of incubation, plates were fixed with trichloroacetic acid and stained using 0.4% SRB. Plates were read using the Wallac Victor plate reader at an absorbance of 490 nm, and % cell growth values were calculated.\n This study was undertaken to examine the influence of individual size and spatial competition on the bioactivity of three coral reef sponges of differing morphologies, occurring in Torres Strait: Coscinoderma matthewsi (a massive, hemispherical sponge), Hyrtios erecta (a club-shaped branching sponge) and Ianthella basta (a fan-like sponge).\n
-
Stereo-Baited Remote Underwater Video Stations (BRUVS) were deployed and retrieved in targeted shallow seabed environments within the proposed Oceanic Shoals Commonwealth Marine Reserve (CMR) in the Timor Sea. The survey concentrated on shelf habitats (< 200m) of the western part of the Oceanic Shoals CMR and included potential biodiversity hotspots such as pinnacles, banks and shoals. In total, 56 stereo-BRUVS were deployed between 31 and 77 metres for one hour according to a regular random sampling design, with minimum spacing of 400 m to ensure independence among samples. This yielded 56 hours of video footage which was subsequently analysed and all species and their relative abundances recorded.\n The Marine Biodiversity Survey of the proposed Oceanic Shoals Commonwealth Marine Reserve (CMR) in the Timor Sea was a research collaboration between the Australian Institute of Marine Science (AIMS), Geoscience Australia (GA), University of Western Australia (UWA) and the Museum & Art Gallery of the Northern Territory (MGNT). The survey was undertaken between 12 September and 6 October 2012 on the AIMS Research Vessel, RV Solander, and formed part of the National Environmental Research Program (NERP) Marine Biodiversity Hub Theme 4: Regional Biodiversity Discovery to Support Marine Bioregional Plans.\n
-
The AIMS Long-term Monitoring Program (LTMP) is designed to detect changes in reef communities at a subregional scale. In this context, a subregion encompasses inshore, mid-shelf and outer shelf reefs across the continental shelf within one band of latitude (a sector). \n \nReef surveys involve three approaches: \n \n1. broadscale manta tow surveys of crown-of-thorns starfish populations and reef-wide coral cover \n2. Intensive photographic surveys of stationary seafloor (benthic) organisms on fixed transects \n3. intensive visual counts of reef fish, juvenile corals, crown-of-thorns starfish, coral-eating snails and coral disease and bleaching.\n